
For Retailers
Taiga Analytics turns the cleaned, standardized data from your POS, back office, fuel, loyalty and labor systems into dashboards for everyone on your team, from store managers to executives.

"Taiga helped us stop guessing. We now have the data to know what's working, what's not, and what to do next."
Michele Truelove, VP of Operations, High's of Baltimore
Every dashboard runs on the same reconciled data, so a number means the same thing in every report and at every store.
Sales by category, brand, supplier and SKU, down to the individual receipt at any store.
SKU performance, volume, growth and drain, plus market basket pairings by size and margin.
SKU sell-through checked every 15 minutes across all stores, with alerts when something looks off.
Take rates, average purchase value, basket size and how much of your business comes from loyalty members.
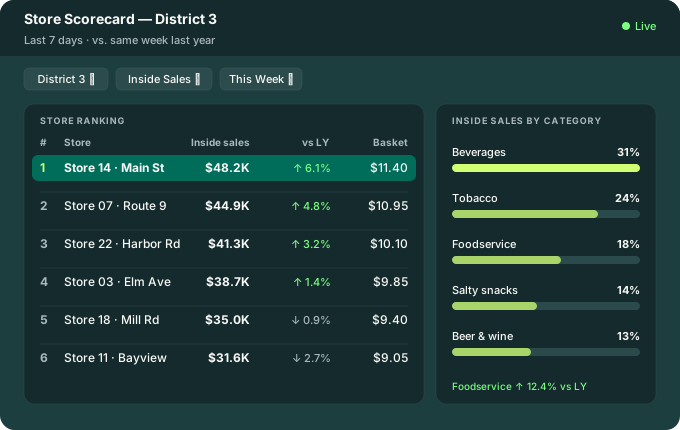
Sales per labor hour, traffic against schedules and store scorecards, pulled from your payroll and scheduling systems.
Unusual discounts and voids flagged to the right person, with the full receipt for anything under review.
Mismatched costs, pricebook inconsistencies and unintended discounts caught the same day they happen.
Tank levels, deliveries and variances across the network, with weighted average cost and margin by grade and store.
Add AI Connector, Financial Insights and Competitive Fuel Pricing to your Taiga Analytics account when you're ready. Each one works from the same cleaned data as your dashboards.
Ask questions of your store data in Claude, ChatGPT, Gemini or Copilot. Answers come from your sales, fuel, loyalty and promotion data in Taiga, using the same cleaned numbers as your Taiga reports.
Explore AI Connector →Your general ledger next to your store data, with views for controllers, owners, district managers and store managers.
Explore Financial Insights →Your posted fuel prices against nearby competitors, with a recommended strategy for each store and grade.
Explore Competitive Fuel Pricing →Bring the question your team asks most. We'll show you the dashboard that answers it.
Each person sees the stores and numbers that matter to their job, and permissions keep everyone to the stores and data they're cleared to see.
You keep the systems that run your stores. Our team handles the setup and trains your people.
Taiga Sync works with the POS, back office and fuel systems c-store chains already run. It's installed remotely on each store's back office PC, in about five minutes per site, with read-only access to your systems.
The Taiga Data Platform reconciles the numbers across your systems and maps them to the NACS standard.
We train your team on the dashboards they'll use, and your data stays yours.
Book a demo and we'll walk you through the dashboards your team would use day to day.