The coronavirus pandemic has created chaos and confusion across our industry. At Taiga, our mission is to bring order to chaos by identifying new trends rapidly through data analysis. We created the New Normal Newsletter to share some of the most common questions that we’ve received and the resulting analysis. In this edition we look at convenience store fuel sales.
This volume analyzes recent fuel price volatility and its impact on convenience store operators trying to maintain their profits and customers.
Observation 1: It helps to have the 30,000 foot view
What if you could expand your view of the market? It’s important to track your competitors down the road, but it’s just as important for you to see price trends occurring across your state so you can anticipate them before they hit your local area.
A Front Office Platform now allows you to track fuel price trends as they sweep across different regions of the US. These maps update on an hourly basis. Now you can see and anticipate a price restoration before it arrives locally.
What you see here is an interactive map where blue represents price increases and red represents decreases. The timeline cis customizable to show monthly, weekly and even daily trends. The map can look at a specific region like the state of Ohio or show the entire country. This example is from the actual price restoration activity in the Midwest last week. After weeks of modest competition and high margins, the competition came roaring back to life with the restorations in June. This is literally the 30,000 footview. Using tools like this will help keep fuel sales at you convenience store on track.
Helpful Tip: It’s important for convenience store operators to realize that they don’t have to purchase fuel from their local city. Jobbers are hauling fuel across wide regions so it’s important to look at all of your options within your region. Convenience stores have many fuel options to impact sales.
Observation 2: Fuel prices are not likely to settle down anytime soon.
If there is one industry that’s seen turmoil in recent times it is the oil industry. Oil (and fuel) prices have been affected by all these major changes:
- Fifteen years ago the commentators told us we were at “peak oil” in the US and that US production would decline rapidly in the 2010’s. We were supposed to run out of oil and gas and have to import it from overseas. We even built LNG facilities so we could import natural gas. The coming shortage caused fuel prices to go way up.
- The US discovered fracking, in just a few years we not only became self-sufficient, we became the biggest oil producer in the world. Prices went down again. Unfortunately the commentators kept their jobs.
- The Covid lockdown reduced fuel demand by 60% in March. At the same time, fear in the hearts of shoppers kept them away from crowded supermarkets and big-box stores, driving some of them to shop at conveniece stores. The people who used to stop and shop after buying fuel cut way back, but the new “grocery buyers” took their place. The mix of products sold went through wild gyrations and convenience stores experienced many stock outages as management tried to change their ordering to match the new buying patterns. The operators who guessed right made money – the rest waited for the return to normal. They are still waiting.
- Russia and Saudi Arabia couldn’t agree on a response to the lockdown and instead got into a squabble, increasing production until we had every tanker in the world filled to the gunnels anchored outside ports. Some refineries couldn’t get enough business and closed. The glut caused prices to drop to levels not seen in decades, but not without a lot of hair-raising moves up and down from day to day.
So what might happen next? Recent market pricing allowed convenience stores to maintain high margins, which offset some of the pain of lower volumes. But now competition is coming back and margins on convenience store fuel sales will probably be thin. So what should operators do?
When prices change frequently and your margins depend on meeting the market price, you need to be aware of price changes and stay one step ahead of your competitors.
Most operators set prices by looking at certain nearby competitors. Often, this involves a staff member driving around and scouting for changes. If you’re operating a dozen stores, this is a lot of driving and looking. To alleviate this issue, Taiga’s Front Office Platform is equipped with a real-time competitive fuel price tracking tool.
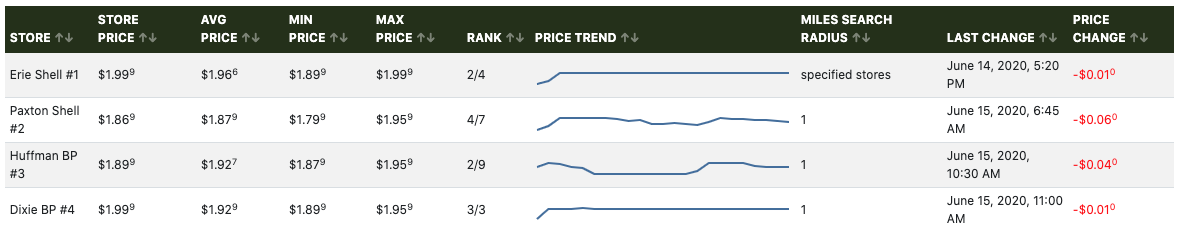
This tool allows convenience store operators to compare each of their stores with a unique group of local competitors. They can also track groups of stores in other areas to act as price barometers. Automated alerts are sent to specific staff members based on custom “triggers” that are set up. For example, an alert can be sent if the system detects that a single store is more than $0.03/gallon above the competitive average for the local area. Quick action preserves margins in a world full of changes and surprises. Take control of fuel sales at your convenience store with tools like these!
Helpful Tip: Another valuable bit of knowledge is up to the minute wet stock inventory figures. If you can help your jobber make fewer stops by directing them to the stores that have the lowest inventory, you will help them operate more efficiently, and more efficiency paves the way to better margins.
Observation 3: Fuel sales at Convenience Stores aren’t as important as they used to be.
Ok, fuel sales are still important, but they have become a lousy indicator of your in-store performance. During the pandemic, new customer groups cancelled out losses from the decline of fuel buyers. The secret to staying profitable was to avoid outages of all the unusual things that the new customers were buying. In our next issue, we’re going to describe some of the capabilities of our Front Office Platform that will help you make stocking decisions in the face of rapid change. It’s sort of a real-time planogram for every category and sub-category in each individual store. It displays how fast items are selling and how soon you will run out. So no more excuses for outages!
The days of using fuel volume as the key indicator of in-store sales, inventory needs, and profitability are gone in the New Normal.
In the past, there were approximate ratios that held between sales rates of various items and the volume of gallons sold. An experienced manager could tell the health of a convenience store just by examining those ratios. If things looked “out of whack” to him, he relied on his past experiences and instincts to identify what issue needed to be resolved. In the New Normal, the Key Performance Indicators “KPI’s” have changed.
To determine these new KPIs, it’s time to start asking new questions:
- With fewer fuel customers, how often do I convert one of my fuel customers to make a purchase in-store?
- How can tracking “conversion rate” from forecourt sales to in-store purchase become one of your new KPIs?
Here are a few additional questions that we have heard from convenience store operators and were able to find the answers in their store data:
- How are store customer counts trending?
- What is the balance between commuters, landscapers, grocery buyers, and other consumer groups?
- What is the store’s average basket size? What is the average basket size of each of my consumer groups? What’s in the basket?
- Which products, brands, and categories are driving growth? Which are in decline?
Adapting is not easy to do, and certainly not easy to do over a Zoom session, as everyone has discovered. Every convenience store is challenged to keep up with all the changes flooding in. The operators who innovate and adapt to the new normal will win customers and better margins.