Our AI learns your business and customer habits and shows you the best opportunities to promote, cross-promote, and increase basket profit.
Optimize Your Promotions And Maximize Profit
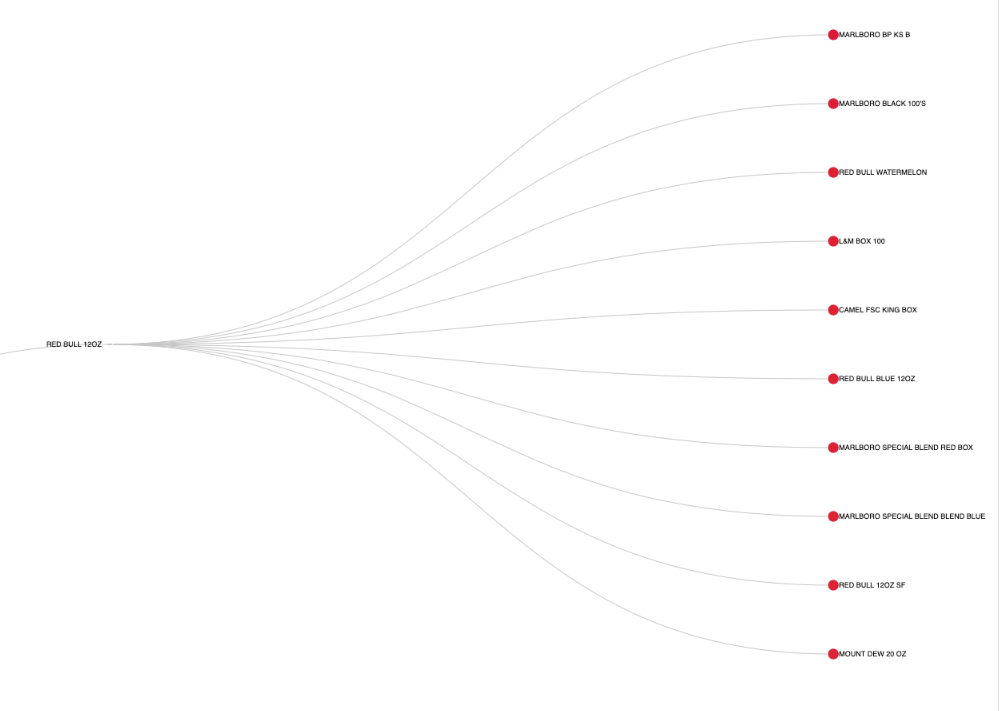
See items purchased together and promote accordingly
See What Your Customers Are Buying
Promotional planning is always challenging – what products should you put together to drive the highest revenue per customer? How should you layout your store to encourage impulse purchases?
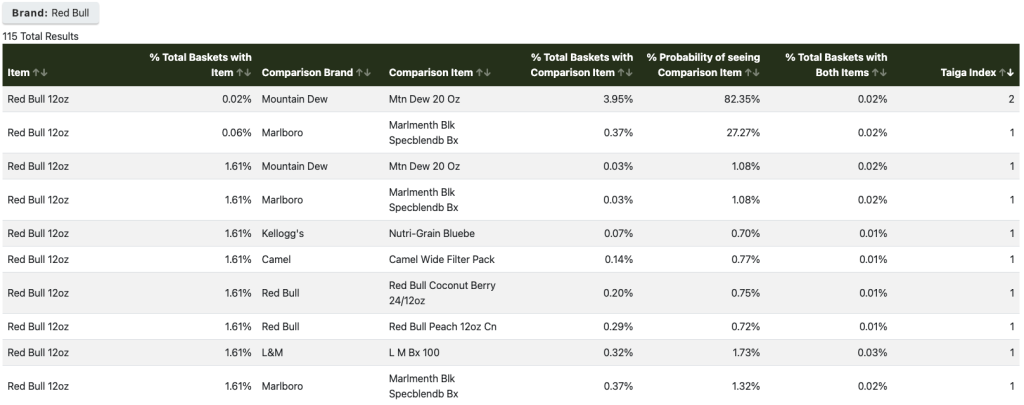
With our Data Driven Market Basket reports, you can compare products and see: basket size, percentage of all baskets with the item, what customers are purchasing together, the probability that 2 items will be purchased together and the Taiga Index – our proprietary measure of the strength of the relationship between two products. With this data you can optimize promotions and shelving to maximize profits!
Market Basket Features
see relationships between products quickly and easily
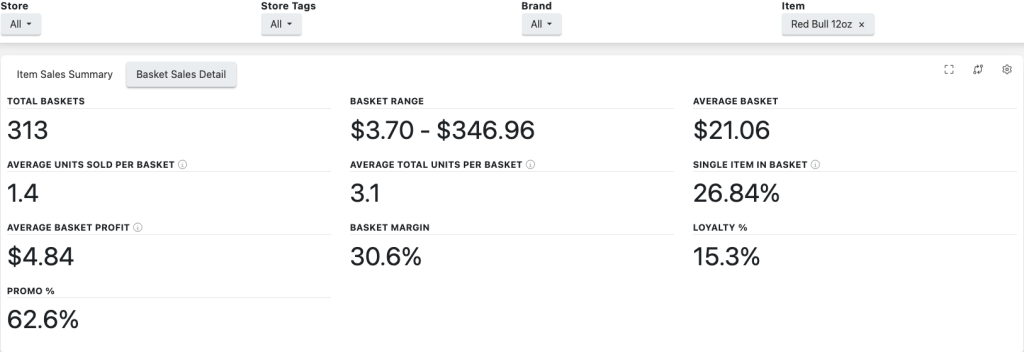
See Basket Information For Any Brand, Down To The SKU Level
Understand How Many Baskets Have Each Item And The Probability of Purchase
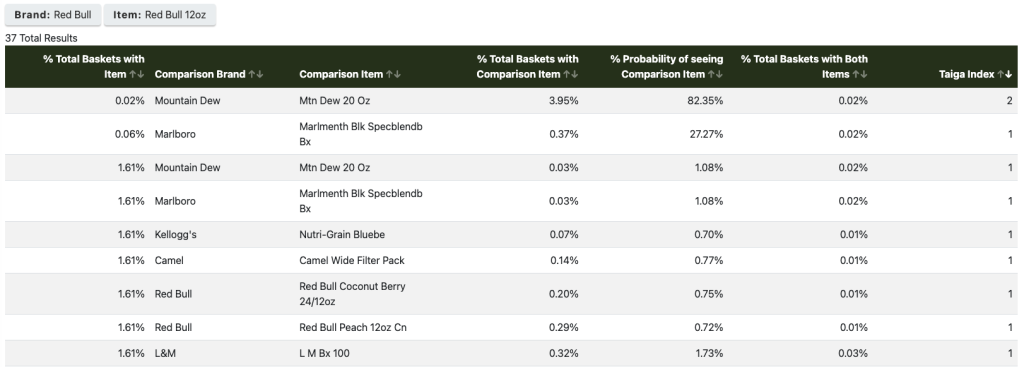
Visually See Items Purchased Together From Most Frequent to Least
Drive Revenue and increase profit by merchandising and promoting likely products together. Have the analysis at your fingertips.
Hear from our Clients
Data Analysis
“A lot of our team will back me up here but we've been starving for data for a while now and this helps with that. We knew it was all there and you've given us a way to get to it.”
A Happy Taiga Client
Start receiving real-time insights into your store’s data today with hands-on guidance and training.